
At the beginning of the 20th Century, the field of astrophysics, as a distinct subfield of astronomy, was just beginning to develop. Astrophysics is essentially the study of the physics behind astronomical objects including the Universe itself. Key in this development was the understanding of stars and how they work, their structure and evolution, and absolutely key to that were observations of star clusters. Why? What makes star clusters so important? A classical astronomical "trick," star clusters are assumed to be a collection of objects all at the same distance , so one can study the relative properties of stars, such as color versus luminosity, without knowing the absolute luminosity. And, of course, once you get a distance to the cluster you can put any such relation on an absolute scale. There is also a second trick (assumption) that also can be utilized and that is the assumption that all the stars in the cluster were formed or born at the same time. Below is an image of one of our clusters, M67.
Figure 1. The open star cluster M67 taken from the digitized Palomar Observatory Sky Survey (AURA, Space Telescope Science Institute, National Geographic Palomar Observatory Sky Survey). The field of view is 30'x30', and North is up and East is to the left.
The goals of this project are (1) to acquaint you with the use of a telescope and moderately modern instrumentation (a CCD = Charge Coupled device), (2) give you a better understanding of real color-magnitude diagrams for star clusters and their relation to the Hertsprung-Russell diagram. To do this, we will take images of open star clusters in several astronomical filters (BVR) and reduce them to produce photometry of a few hundred stars per cluster. If you have time, also do the U filter as the U-B versus B-V color color plot is also instructive! (But note that U is hard, so don't worry if you can't do this. There are a couple of important constraints. The first is that it is necessary to integrate long enough to obtain better than S/ N= 20 (essentially corresponding to 5% photometry) on stars as faint as 18th magnitude. How long will you have to do that on a 12" telescope? Remember that this is a real detector on a telescope in a moderately poor astronomical site so stars will cover many more than a single pixel, so estimate generously. The second is that we will have to mosaic fields, probably 2x2, to cover the clusters to obtain enough stars for the exercise. The clusters we have chosen to study are h and chi Persei (NGC869 and NGC884), Messier 35 and Messier 67. These clusters are bright, nearby and of different ages:
| Cluster | (J2000 | Coordinates) | Other names |
|---|---|---|---|
| NGC869 | 02h 18m 57.7s | +57d 07m 18s h Persei | |
| NGC884 | 02h 22m 32.1s | +57d 08m 39s | Chi Persei |
| M35 | 06h 09m 05.1s | +24d 20m 19s | --- |
| M67 | 08h 51m 20.1s | +11d 48m 43s | --- |
M67 is shown above, below are Palomar Observatory Sky Survey (POSS or "DPOSS" for "Digital" POSS) images of the other three clusters. To give you an idea of the scale of the clusters, these images are approximately 1/2 a degree (30 arcmin) on a side. You can see the cluster and you will also notice other stars --- the background and foreground --- in the field. By definition, an image of a region of the sky gets you everything along the line-of-sight so there will be contamination by foreground and background objects. Don't worry about them for this exercise, they will contribute to the scatter around any relations you see. However in real life, we try very hard to eliminate "non-members" from our samples.

Figure 2. The open star cluster M35 taken from the digitized Palomar Observatory Sky Survey (AURA, Space Telescope Science Institute, National Geographic Palomar Observatory Sky Survey). The field of view is 30'x30'.

Figure 3. The open star cluster h Persei taken from the digitized Palomar Observatory Sky Survey (AURA, Space Telescope Science Institute, National Geographic Palomar Observatory Sky Survey). The field of view is 30'x30'.

Figure 4. The open star cluster Chi Persei taken from the digitized Palomar Observatory Sky Survey (AURA, Space Telescope Science Institute, National Geographic Palomar Observatory Sky Survey). The field of view is 30'x30'.
You will also need to observe standard stars to transform your photometry into the more normal astronomical magnitude scheme. Fortunately, one of our clusters, M67, has a set of well known standard stars for exactly this purpose. Here is an image of the standard star field with stars labeled. The

Figure 5. Identified UBVRI standard stars in the center of the cluster M67. (From R. Schild, 1983).
| Star | V | B-V | U-B | V-R | R-I |
|---|---|---|---|---|---|
| 81 | 10.01 | -0.10 | -0.39 | -0.05 | -0.02 |
| 83 | 13.24 | 0.60 | 0.07 | 0.36 | 0.32 |
| 106 | 13.10 | 0.58 | --- | 0.34 | 0.31 |
| 108 | 9.69 | 1.35 | 1.55 | 0.68 | 0.66 |
| 117 | 12.68 | 0.80 | 0.28 | 0.47 | 0.44 |
| 124 | 12.15 | 0.47 | 0.03 | 0.29 | 0.28 |
| 127 | 12.82 | 0.55 | 0.06 | 0.34 | 0.33 |
| 128 | 13.18 | 0.58 | --- | 0.35 | 0.35 |
| 129 | 13.22 | 0.60 | --- | 0.36 | 0.38 |
| 130 | 12.93 | 0.45 | 0.00 | 0.28 | 0.29 |
| 134 | 12.29 | 0.57 | 0.06 | 0.34 | 0.68 |
| 145 | 12.83 | 0.57 | 0.05 | 0.33 | 0.32 |
| 149 | 12.56 | 0.60 | 0.08 | 0.34 | 0.32 |
Schild, R. 1983, PASP 95, 1021.
Schild, R. 1985, PASP 97, 824.
Eggen, O. J. & Sandage, A. 1964, ApJ 140, 130. (U-B)
Johnson, H. & Sandage, A. 1955, ApJ 121, 616. Orig UBV

Figure 6. Identified UBV standard stars in the center of the cluster M67. (From Johnson & Sandage, 1955, courtesey of NASA's ADS).
You're now ready to go. Figure out what field centers you need to your clusters and roughly how long you need to observe in each filter to get the needed S/N. A good rule of thumb for typical CCD and filter response curves is that B takes about twice as long as V, U about 5 times as long, and both R and I need slightly same integration time as V. This is because your typical CCD is much more sensitive in the red than in the ultraviolet.
If it is not photometric, i.e. if there are clouds or haze, do not observe. The problem is not so much that you can't get an image through clouds than clouds vary in thickness (absorption) with time, thus making it impossible to calibrate all but those fields (e.g. M67) that already have standard stars in them.
Finally, after you have "reduced" your photometry using IRAF or any other reduction system to get magnitudes and colors for the stars plot the color versus magnitude diagram (V on the y-axis, B-V on the x), and color-color diagrams (say U-B on the y-axis and B-V on the x-axis) for each cluster. What do you see? What are the differences and similarities? Look up the distances of each cluster and plot the absolute V magnitude for your stars instead of just the apparent V mangitude. Now what are the differences and similarities? Can you arrange the clusters by age? Here is an example HR diagram:
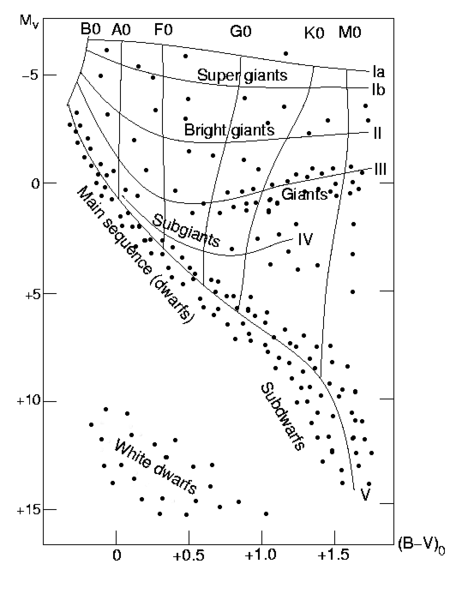
Figure 7. Schematic HR diagram (from Wikimedia).
Go for it!
Copyright John P. Huchra <huchra@cfa.harvard.edu> 2008