|
1. Introduction
The currently proposed concept for the TPF-C coronagraph favors a classical Lyot coronagraph consisting of the
telescope system with wavefront correction optics, an occulter mask in the first focal plane followed by more
optics, the Lyot stop, and a camera. This concept requires a near perfect wavefront throughout most of the optics,
setting a very challenging requirement of much better than λ/1000 on the primary mirror surface accuracy and the
wavefront control system to correct for residual errors. The concept of the Labeyrie multi-step speckle reduction
method is a potential technique to reduce these challenging surface requirements to more achievable accuracies
of λ/100 to λ/1000 by correcting and removing speckle light after the initial coronagraphic step. In the following
paragraphs, we will introduce the multi-step speckle reduction technique, present computer simulation, and will
discuss its advantages, requirements, and potential applications.
2. Labeyries Multi-Step Speckle Correction Method
The optical layout of Labeyries Multi-Stage Speckle Correction Method is shown in Figure 1. Instead of correcting the
telescope wavefront before the coronagraph, Labeyrie suggested (Labeyrie 2002) that measurements are made of the
phase of the speckle pattern in the image plane of a Lyot coronagraph. The speckle pattern is the result of phase errors
introduced by the telescope system and the occulter mask in the coronagraph (all following optical elements contribute
only negligible amounts to the speckle light since the bright stellar light has been mostly suppressed at this point). An
adaptive element (e.g. a deformable mirror) is then applied with a conjugate of the phase in the speckle pattern, setting
the net phase to approximately zero. This results in the speckle having a plane wave component emanating from the
coronagraph focal plane. A lens following the corrector re-images the telescope pupil. The plane wave of scattered
light will be mostly focused into a small spot in the center of that re-imaged pupil plane while the planet light is distributed
over the entire aperture. A second occulter blocks the central spot and the passing planetary light is re-imaged to another
focal plane with greatly reduce speckle background. Measurement of the phase should be made with a field that does not
contain a planet or the other faint object under investigation, e.g. by imaging another star. This correction will then
improve the contrast between the faint object and the background by as much as a factor of 10. Several additional stages
of correction continue to improve the contrast ratio. The pupil plane stop can be fairly large (e.g. up to 10 % of the pupil
diameter) without attenuating much of the signal of the off-axis planet. Imperfect correction of the focal plane phase just
causes the spot to spread out but it is still blocked by the stop. Initial numerical simulations showed good results with a
wavefront error of 1/1000 wave of the initial wavefront and a laboratory demonstration is under way.
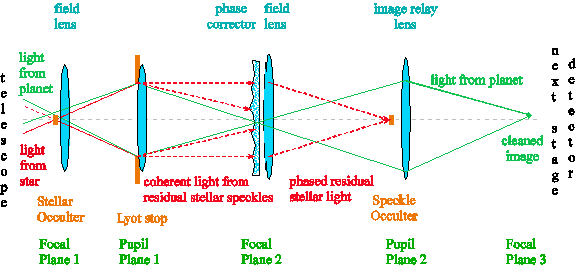 Figure 1: Schematic setup for Labeyries multi-step speckle correction approach. The first part of this schematic shows a
standard Lyot coronagraph (Focal Plane 1 and Pupil Plane 1). However, instead of a camera, a phase corrector is placed
near Focal Plane 2. It aligns the phases of the speckle light such that it can be focused onto a second occulter near Pupil
Plane 2 where it is removed. Left is the planet light which is then focused onto a camera (or enters a second speckle
reduction step).
Figure 1: Schematic setup for Labeyries multi-step speckle correction approach. The first part of this schematic shows a
standard Lyot coronagraph (Focal Plane 1 and Pupil Plane 1). However, instead of a camera, a phase corrector is placed
near Focal Plane 2. It aligns the phases of the speckle light such that it can be focused onto a second occulter near Pupil
Plane 2 where it is removed. Left is the planet light which is then focused onto a camera (or enters a second speckle
reduction step).
3. Simulations
Before designing the testbed to demonstrate the multi-step speckle correction technique, we simulated the approach using
Fourier optics. The steps in our simulation are: (1) simulating the telescope, (2) simulating the coronagraph, (3) simulating
the multistage speckle reduction, and (4) applying possible post-processing to the acquired images. The imperfections in
the primary mirror are simulated using the specification of the power spectral distribution (PSD) for the TPF demonstration
mirror. The resulting phase screen is then rescaled to the desired wavefront error. We assumed a wavefront error of λ/1000;
however, this number can be changed to any wavefront error. The type of occulter in the coronagraph can also be selected.
The current choices are a sinc2 or Gaussian profile absorbing mask, but adding other types is straight forward. The mask
parameters, e.g. diameter of the mask, can be adjusted to optimize the system. Also, a rest-transmission can be specified
to better simulate real occulters. For the presented simulations, we assumed a value of 10-10. The phase corrector did
correct the phase on the same pixel raster as the simulation was performed. In our testbed, the phase corrector will not
have such a high resolution. Thus, future improvements of the simulation will take the limited resolution of the phase corrector
into account.
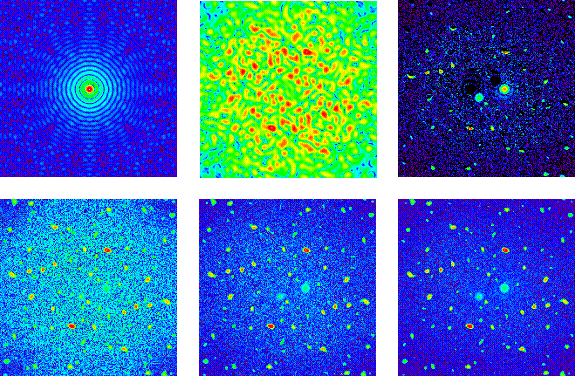 Figure 2: Result of simulations of Labeyries multi-step speckle reduction technique. The top left panel shows the point
spread function and the top middle panel the speckle background after suppressing the star light. The next three panels show
the speckle reduction after: 3 steps (bottom left), 5 steps (bottom middle), and 7 steps (bottom right). The top right panel
shows further improvements of the 7-step image by subtracting the same image after rotating it by 180o.
Figure 2: Result of simulations of Labeyries multi-step speckle reduction technique. The top left panel shows the point
spread function and the top middle panel the speckle background after suppressing the star light. The next three panels show
the speckle reduction after: 3 steps (bottom left), 5 steps (bottom middle), and 7 steps (bottom right). The top right panel
shows further improvements of the 7-step image by subtracting the same image after rotating it by 180o.
Figure 2 shows typical results of our simulations. The resolution is 512 x 512 pixels showing a FOV of 25 l/D. The top left
panel shows the ideal point spread function and the top middle panel the speckle background after the star light has been
suppressed by a Gaussian occulter and the exit pupil has been reduced to 90%. The next three panels show the improvement
of the speckle reduction after: 3 steps (bottom left), 5 steps (bottom middle), and 7 steps (bottom right). The simulated planets
at (4, 0)*λ/D and at (-2,-2)*λ/D can be identified after 5 to 7 steps. The top right panel shows a post-measurement data
processing step by subtracting the even part of the image. The planets still show up as circular objects with a point-symmetric
negative counterpart. Since the shape of the planets seems to be invariant when shifting the image, but the shadows of the
speckles (the negative component) move around the speckles, planets should be easily identifiable.
An important result of this simulation is that a phase only correction would need more than 3 correction steps which might be
doable, but would increase the complexity of a coronagraphic camera tremendously. However, the number of speckle reduction
steps can be reduced to one, if both, the phase and the amplitude, can be corrected. If we apply not only a phase correction but
also an amplitude correction, all the speckle energy should be concentrated at DC. Thus, in theory, with a simple DC block all
of the suns energy could be removed. However, this cannot be achieved in a real system with wildly changing amplitudes across
the image. A more realistic solution is to introduce a mask with the inverse of the speckle amplitude averaged over smaller areas.
The only disadvantage would be a reduction in through-put. The attenuation of such a mask can be defined as:
m(x)=(fmin/f(x)) < 1.0
where f(x) is the square root of the image measured at the output of the coronagraph and fmin determines a threshold value for f(x).
Figure 3 shows the results for a number of values of fmin which become more aggressive from the left to the right. Compared to the
results of a phase only correction, the phase and amplitude correction also attenuates the planet light. The simulation shows that
sufficient speckle suppression can be achieved with mask transmissivities of 0.5 to 0.2. For this case, the planets are clearly
identifiable. Considering that such a planetary system would have to be revisited over several orbital epochs, planets can be
identified without doubt.
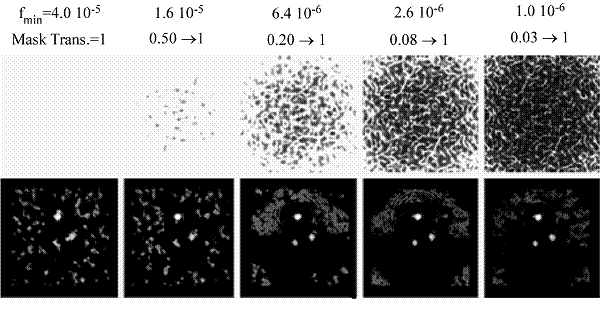 Figure 3: Top row: Amplitude modulation mask. Bottom row: Output of a single stage with amplitude modulation mask and phase
correction element. Image subtraction as describe above was also applied for the final result.
Figure 3: Top row: Amplitude modulation mask. Bottom row: Output of a single stage with amplitude modulation mask and phase
correction element. Image subtraction as describe above was also applied for the final result.
| Reference: | Tolls, Volker; Aziz, Michael; Gonsalves, Robert A.; Korzennik, Sylvain; Labeyrie, Antoine;
Lyon, Richard; Melnick, Gary; Schlitz, Ruth; Somerstein, Steve; Vasudevan, Gopal; Woodruff, Robert
"Study of coronagraphic techniques;" Space Telescopes and Instrumentation I: Optical, Infrared, and Millimeter. Edited by Mather, John C.; MacEwen,
Howard A.; de Graauw, Mattheus W. M.. Proceedings of the SPIE, Volume 6265, pp. 62653K (2006)
Tolls, Volker; Aziz, Michael; Gonsalves, Robert A.; Korzennik, Sylvain; Labeyrie, Antoine; Lyon, Richard; Melnick, Gary; Somerstein, Steve;
Vasudevan, Gopal; and Woodruff, Robert;
"Study of Coronagraphic Techniques;" in Direct Imaging of Exoplanets: Science & Techniques. Proceedings of the IAU Colloquium #200, Edited by C. Aime and F. Vakili. Cambridge,
UK: Cambridge University Press, 2006., pp.457-460
Gonsalves, Robert A.; Tolls, Volker, "Phase diversity in an exo-planet imager," SPIE, Volume 5905, pp. 322-329, 2005
|
|
|